1. MitoNet - Video Tutorial
The video tutorial below illustrates MitoNet's main features by walking the user
step-by-step through the process of exploring mitochondrial network alterations
in a complex disease (using brain transcriptomics data for Parkinson's disease
as an example) and uploading and analyzing a new user-defined dataset (if no
video is shown below this text, please adjust your browser settings to
enable scripts for displaying embedded videos - we recommend to use the "fullscreen" mode by
clicking on the corresponding symbol at the bottom right of the video).
2. Introduction and feature overview
Several neurodegenerative diseases, cancers and other complex disorders have been linked to malfunctioning of the mitochondria, the main cell organelles responsible for energy production.
MitoNet is a mitochondrial protein-protein interaction network, online visualization and data exploration tool,
enabling a detailed exploration of mitochondrial network deregulations in disease-related omics datasets.
The user can investigate clusters of deregulated genes in pre-defined network visualizations for Alzheimer's disease and Parkinson's disease, or
upload statistics for a new omics dataset to analyze mitochondrial deregulations at the global network level, the level of
protein complexes or individual genes/proteins of interest. The main features of the software are:
- User-defined omics data can be uploaded to generate interactive and searchable mitochondrial network visualizations of the data within seconds to minutes
- MitoNet provides access to two pre-defined network visualizations for Alzheimer's and Parkinson's disease transcriptomics data, revealing shared and distinct network deregulations
- The software enables an integrated analysis of different omics datasets at the level of primary statistics (e.g. combined analysis of different neurodegenerative diseases)
- Individual genes/proteins of interest can be retrieved quickly to study their surrounding network, deregulations, topological properties and functional annotations in public databases
3. Quickstart guide
The simplest way to become familiar with MitoNet's features is to access the example network visualizations for Alzheimer's and Parkinson's disease gene expression data by choosing
the corresponding options on the main web-interface (see Fig. 1). Please note that accessing these large networks may require a short waiting time, in particular
when loading the networks for the first time.
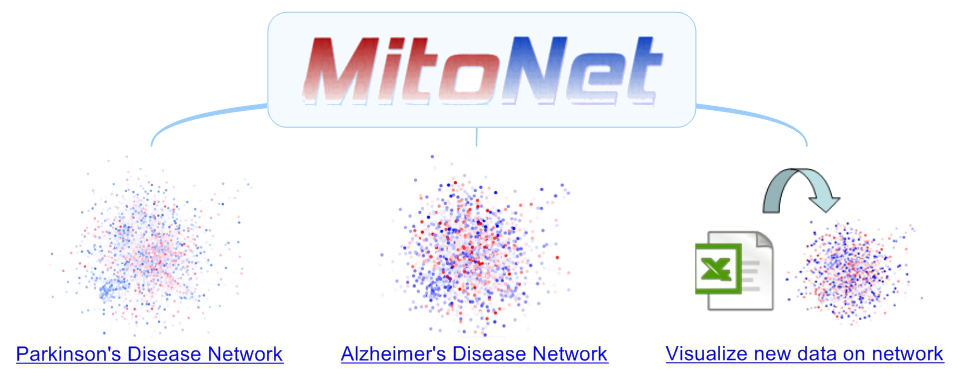
Figure 1: Main web-interface of MitoNet providing access to the pre-defined network visualizations for Parkinson's and Alzheimer's disease (left and center) and to a dedicated module for analysing new user-defined data (right)
When a network has been loaded, the user will first see a global perspective of the graph representation (see Fig. 2), in which blue nodes represent down-regulated genes/proteins in the condition of interest (e.g. Alzheimer's or Parkinson's)
while red nodes indicate up-regulation (darker colors reflect larger absolute logarithmic fold changes as compared to the control condition, white nodes correspond to genes without any associated deregulation information). Lines between the nodes
represent protein-protein interactions reported in public data repositories.
Using the mouse wheel, the user can zoom into the network until the gene labels for individual nodes appear. When clicking on a node of interest, the surrounding neighborhood is highlighted and
further information on the gene/protein appears in a panel on the right side of the browser window. Alternatively, the user can also find genes of interest in the network by typing the corresponding gene name (using the HGNC official
gene symbol format) in the search box on the left (see left in Fig. 2).
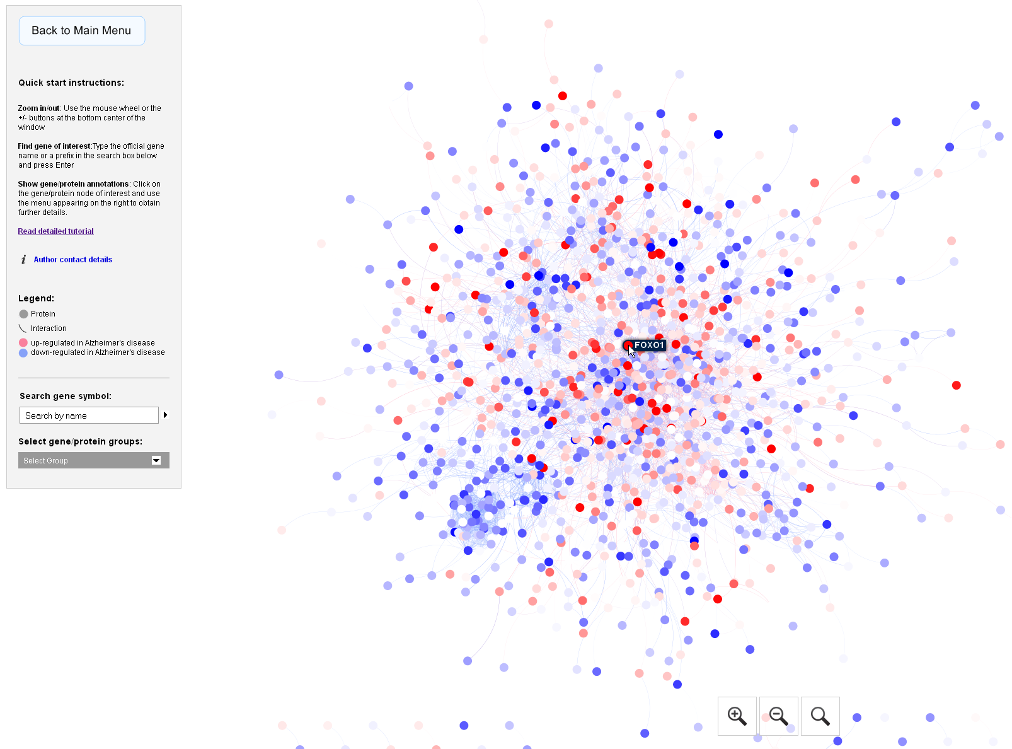
Figure 2: Example network visualization with blue nodes for down-regulated and red nodes for up-regulated genes in the condition of interest (here Alzheimer's disease post-mortem gene expression in the brain as compared to non-demented controls). When hovering the mouse over a node, the corresponding gene name (here: FOXO1) is shown
The following sections will provide instructions on how to analyze user-defined omics data with MitoNet and discuss the features of the network visualization in more detail.
4. Formatting and uploading of new data
MitoNet provides a simple interface to analyze user-defined omics data by generating custom mitochondrial network visualizations (third option on the main web-interface). For this purpose, gene names can be copied and pasted into a text box in human ENSEMBL format, followed by two numbers representing the log. fold change (or any similar score reflecting up-/or down-regulation in a condition of interest) and the significance of the corresponding gene given by a p-value score (see example in Fig. 3). This simple 3-column format can be specified either using spaces or tabs in between the gene names and numbers, entering one gene per line.
As long as mitochondrial genes present in the network are included and provided as standard ENSEMBL identifiers, the application will accept all input data derived from any omics experiment. If the users clicks on the "Load example" button the input text box will be filled with example data.
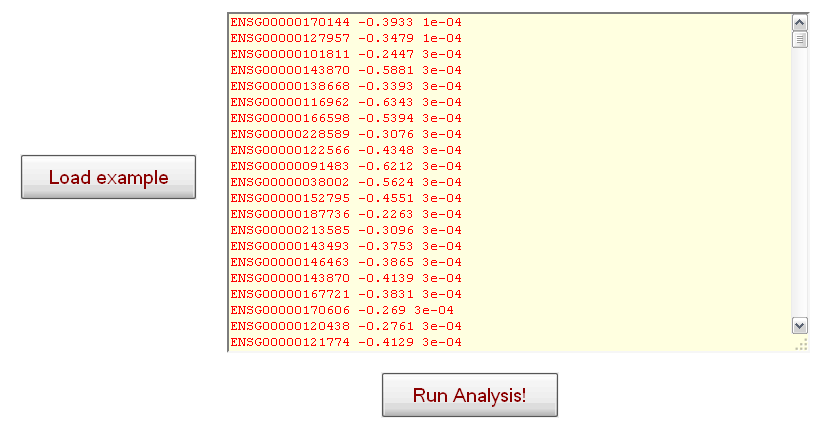
Figure 3: Interface for uploading user-defined gene deregulation statistics to be mapped on the mitochondrial interaction network (including example data consisting of ENSEMBL-identifiers and corresponding log-fold changes and p-values separated by white spaces).
A network visualization for the data inserted by the user or the pre-defined example is generated automatically by pressing the "Run Analysis" button (see Fig. 3 bottom). The user is redirected to a temporary status page and after a short waiting time (few seconds to minutes, depending on the size of the uploaded data),
the generated network visualization is loaded. In this graph-based visualization, genes with a corresponding protein in the mitochondrial interactome
will be in red, blue or white, depending on whether the corresponding fold change statistic entered by the user is positive, negative or the gene was not
covered in the input. The features of the network visualization are the same as those for the pre-defined Alzheimer's and Parkinson's disease
networks (see sections "2. Quickstart guide" and "4. Detailed discussion of features"). If the user-defined input is not accepted or the whole network remains white (i.e. all nodes are uncovered), the user may want to check whether the input genes are provided in standard ENSEMBL format and include mitochondrial genes present in the network (fold change scores should be on logarithmic scale with negative scores for down-regulated and positive scores for up-regulated genes, and p-value significance should have values in the range from 0 to 1).
Please
contact us, should you experience any kind of problems when uploading or analyzing your data.
5. Detailed discussion of features
Apart from the standard network exploration features described in the Quickstart guide, MitoNet provides various options to investigate
mitochondrial network deregulations in more detail. Network alterations in omics datasets often affect protein complexes in a coherent fashion
and the mitochondrial complexes I to V play central roles in energy metabolism as well as in different mitochondrial and
neurodegenerative diseases. Therefore, the mitochondrial complexes can be highlighted in the network (after switching to the global view by
clicking on the lense symbol at the bottom right side of the center) by activating the "Select gene/protein groups" menu on the left and choosing one
of the complexes (see Fig. 4 in which complex I has been selected and highlighted in the network).
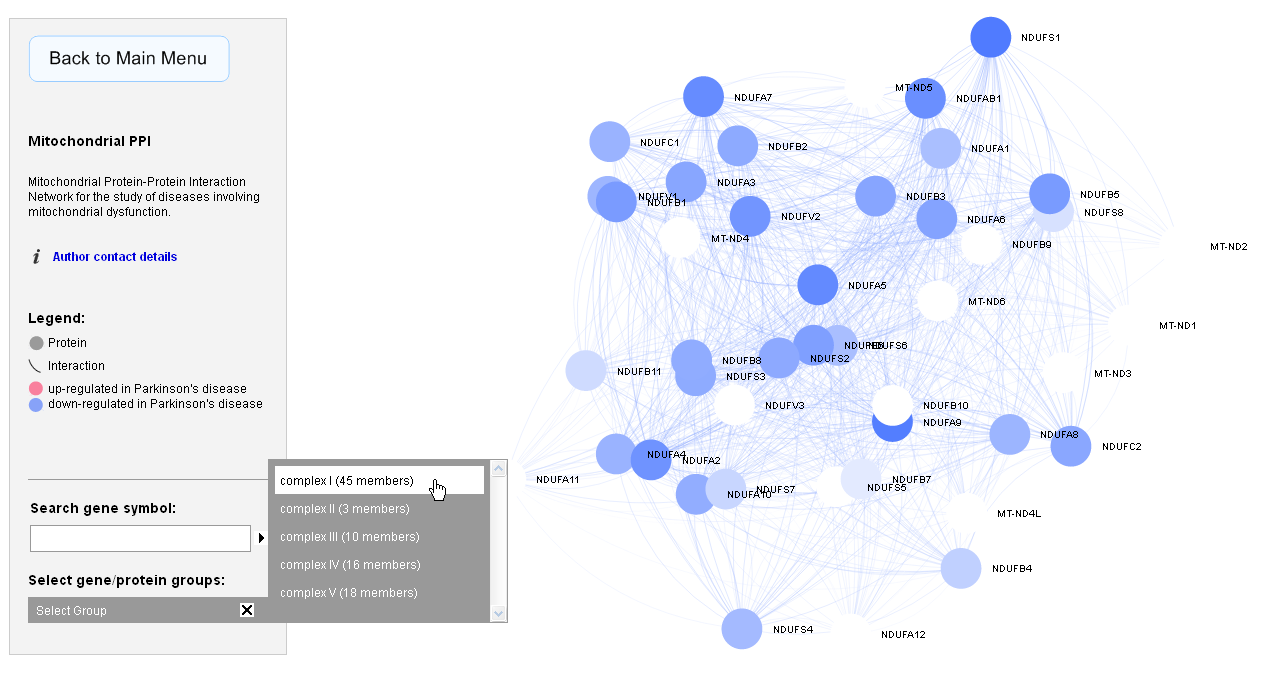
Figure 4: Menu to highlight mitochondrial protein complexes in the network visualization (here complex I has been chosen).
To obtain detailed information about the network topological properties and omics deregulation statistics for a gene of interest, the user only needs to click
on the corresponding gene node in the network and an information pane will be displayed on the right side of the browser window (see Fig. 5).
Depending on the loaded dataset the displayed statistics may include fold changes, p-values or Z-score statistics and several network topological
characteristics (network centrality measures like closeness centrality, betweeness centrality, average shortest path length etc. and local network clustering
measures like the clustering coefficient; see Fig. 5 - for a detailed discussion of the different network topological properties, please refer to R. Albert,
"Scale-free networks in cell biology", J. Cell Science, 2005;
http://jcs.biologists.org/content/118/21/4947.full).
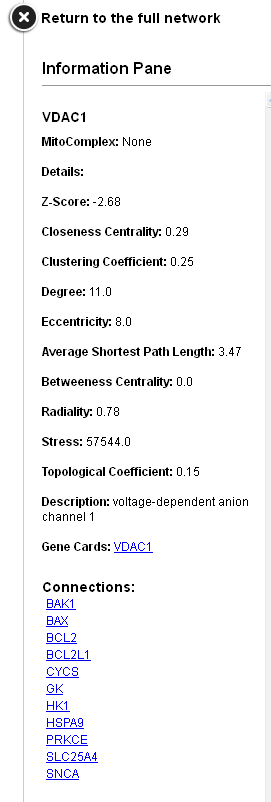
Figure 5: An information pane with details on the network topological properties and deregulation statistics can be opened for each gene of interest (here: the mitochondrial voltage-dependent ion channel VDAC1).
Due to the size and complexity of the mitochondrial interaction network, locating a gene/protein of interest is facilitated via a search panel on the left (above the "Select gene/protein groups menu", see Fig. 6). By typing the corresponding gene name in the search box (in HGNC official gene symbol format) and pressing Enter, the chosen gene and its direct neighbours will be highlighted in the network and the information pane with omics statistics and local topological properties (see above) is displayed automatically. Instead of typing in the full gene name, a 3-letter prefix will in many cases be sufficient to confirm the presence of a gene of interest in the network and locate its position. Via hyperlinks in the "Connections"-section of the information pane, the user can also quickly switch the focus to a neighbouring gene, display its topological and omics deregulation properties and view its surrounding network neighbourhood.
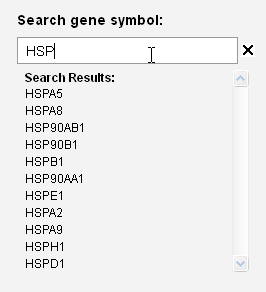
Figure 6: Search panel to locate genes of interest in the mitochondrial network.
When uploading new omics statistics on MitoNet to generate a network visualization, the user can exploit that fact that any numerical values in the range of 0 to 1 for the p-value significance score, and -Infinity to +Infinity for the logarithmic fold change statistic are excepted as input to create different custom visualizations for a studied omics dataset. For example, to only visualize up-regulated genes, the log. fold change value for down-regulated genes can simply be set to 0 (or the corresponding genes can be removed from the input), or to visualize the overlap of two different omics datasets, shared up- and down-regulated genes and genes with diverse deregulation patterns can be colour-coded in a unique manner by specifying different values for the log. fold change attribute (e.g. using negative values for shared down-regulation, positive values for shared up-regulation, and 0 for opposite deregulation patterns). Similarly, the p-value significance score attribute may be used to encode and display other quantitative information of interest, e.g. a meta-analysis significance score for data that has been integrated across different studies, a variance score or any other numerical score that can be assigned to genes or proteins.
6. Troubleshooting (system requirements & browser compatibility)
MitoNet is compatible with any recent version of a Javascript-enabled web-browser supporting Canvas on common 32-bit
operating systems (Windows, Linux and MacOS; please note that Internet Explorer 8 does not support Canvas, but IE 9 or later versions are compatible). The web-application was developed for a screen resolution of 1680x1050, but has been tested successfully on various other systems with higher resolution. No browser plug-ins are required to display the visualizations, but the generation of a new network visualization from user-defined input data may require a short waiting time, depending on the dataset size (usually few seconds to minutes). The best performance was observed on the latest versions of the Chrome browser.
Should you experience any problems when displaying the web page or downloading results, please
contact us.